Introduction

A number of methodologies have been utilized in the study of the city and landscape of Roman Corinth. The ancient Roman city was very large in size, 240.6 ha., and was founded directly on the site of the former Greek city. In the modern day a farming village exists at the site of the ancient city.

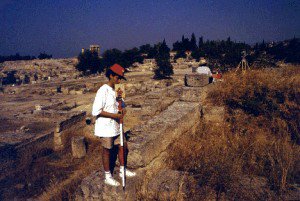
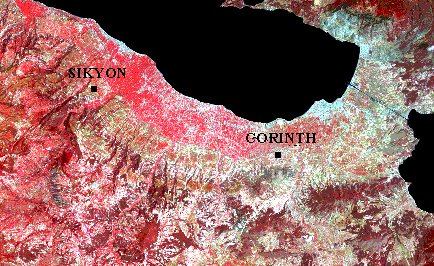
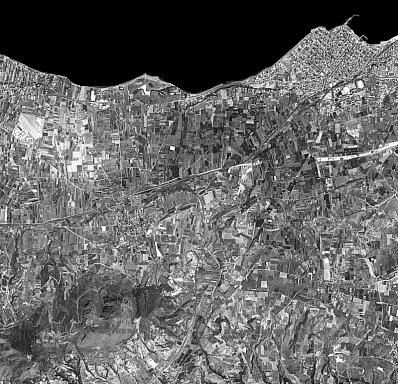
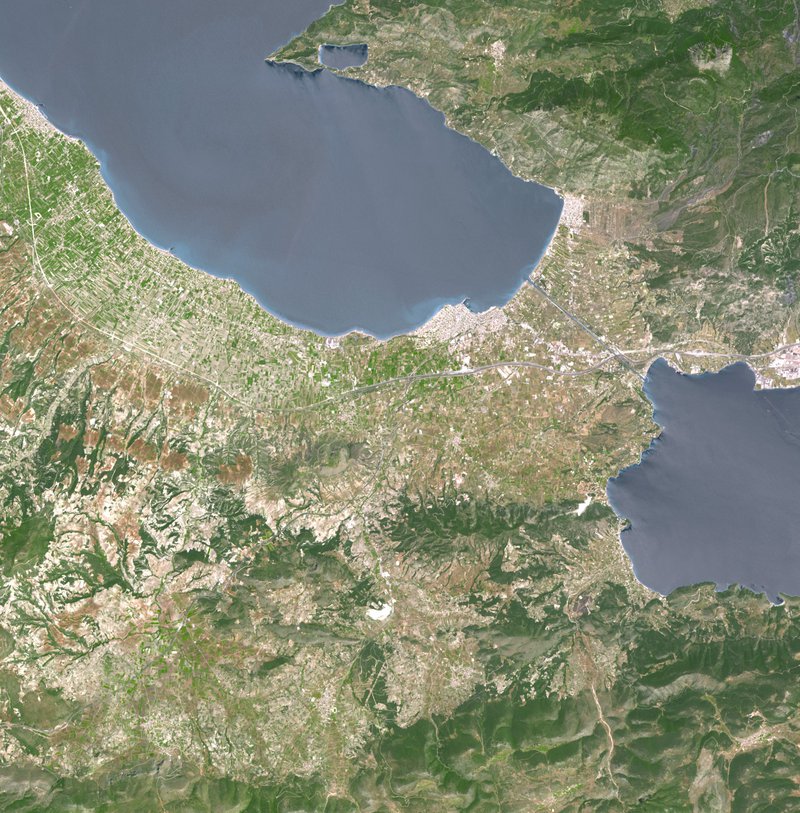
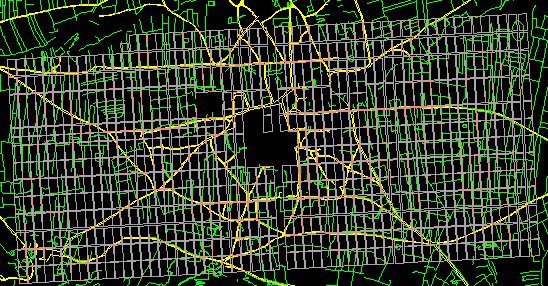
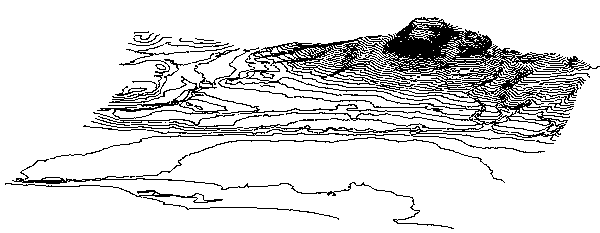
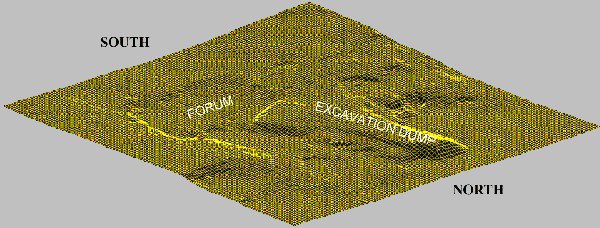
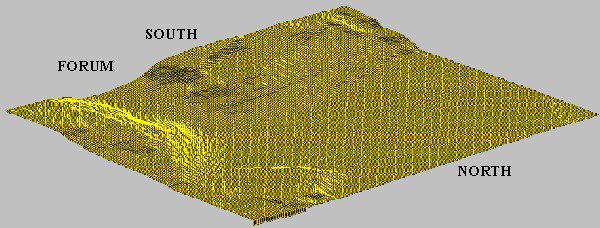
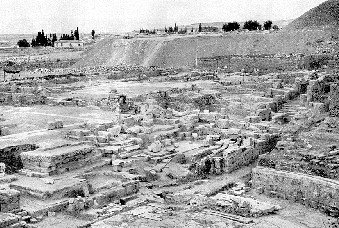
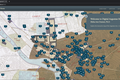
The Corinth Excavations of the American School of Classical Studies, begun in 1896 has undertaken excavation in many different areas of the ancient city including Acrocorinth. These areas of excavation are sometimes separated by as much as 3-4 km in distance. One of the goals of the Corinth Computer Project has been to make a highly accurate modern map including as many as possible of all of the excavated areas of the city. This has made it necessary to survey, by means of an electronic total station, all above ground monuments and buildings and this was accomplished in a series of summer seasons between 1988-1997. This survey forms the backbone of the entire project creating the armature for other kinds of data to be associated. In addition a large number of topographical maps have been digitized and calibrated with the computerized topographical and architectural survey as well as low level and high level air photographs and satellite images.

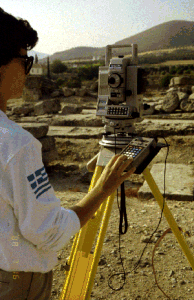
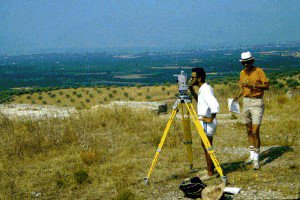
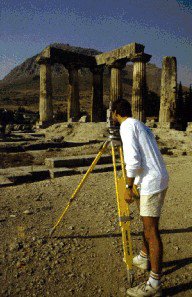
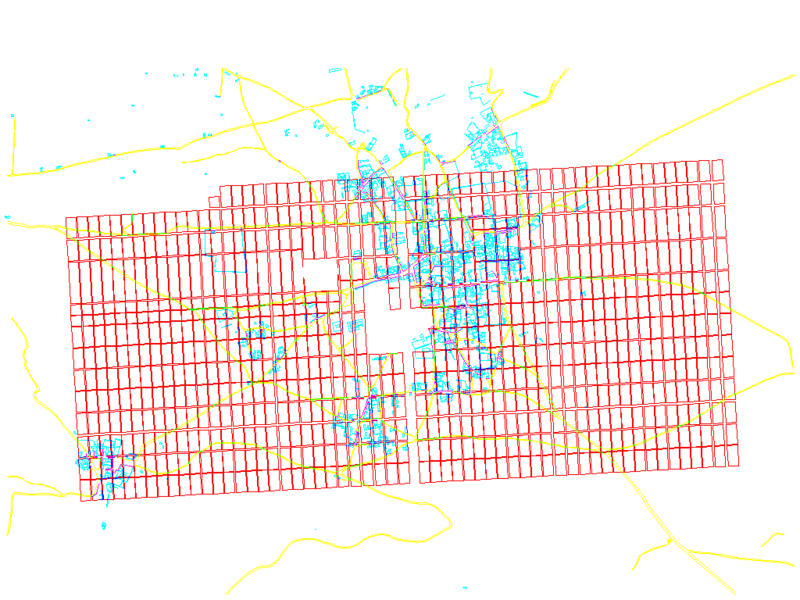
As a part of the present project, most of the major architecture and all of the roadways of the Roman city, known as a result of excavation, have now been surveyed in the field by means of an electronic total station [an electronic theodolite and an electronic distance measuring device (EDM)], guaranteeing a very high degree of precision. This equipment was used in each of the ten summer seasons of work and provided continuity from year to year, as well as the necessary high standards of accuracy for the project as a whole.

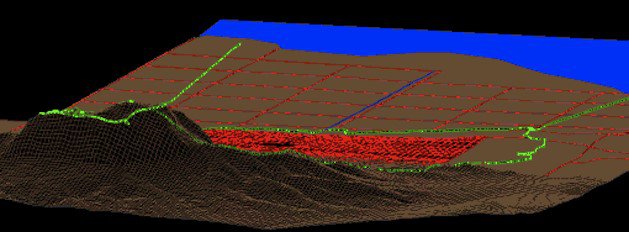
The framework for the modern computerized survey has been the Greek Geodetic Survey that was set into place by the Greek government in the early 1960’s. The basis of the geodetic system was an air photographic survey which was then used to create a corresponding land survey with permanent geodetic markers. Each cement marker has an x and y coordinate and an elevation. Four of these geodetic pins are within the range of our survey and we used these as the basis of our field and laboratory work. What this meant is that all of our evidence has been associated with the same coordinate system, regardless of its date of excavation or publication, or the scale or size of the original drawing and this has led to the discovery and definition of the Roman colonial city plan. All of our data not surveyed in the field, which includes actual-state drawings of excavations, some of which are no longer visible, as well as some photographic evidence, has been entered into the database and carefully calibrated, if necessary, in order to make it correspond accurately with the surveyed material in the same coordinate system. This is one of the procedures where the use of the computer is invaluable since the ability to draw on hundreds of “layers”, in differing colors, all within the same master drawing, means that associations that would not necessarily be possible otherwise, become obvious.

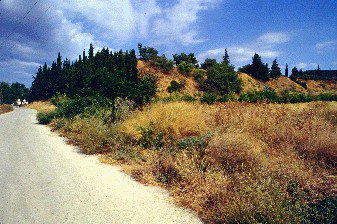
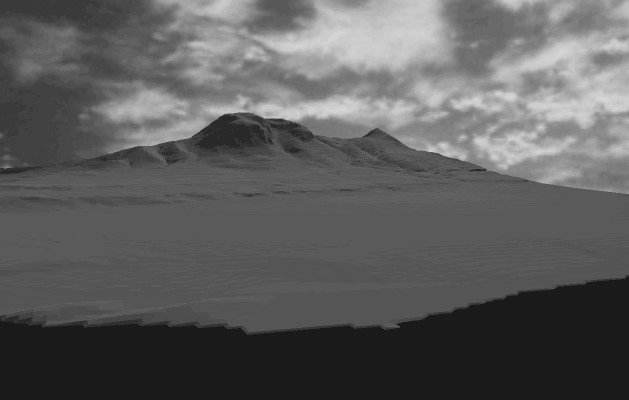
For the study of the city proper, we have mapped ca. 30 km2 of land in and around the ancient city. This area includes the region within the Greek city circuit wall, including Acrocorinth, as well as the broad and fertile plain to the north of the ancient city as far as the Corinthian Gulf, most of which, as will be discussed below, is found to be within the Greek Long Walls. There is also additional land included in the present study both to the east and the west of the Long Walls. As the Corinth Excavations of the American School of Classical Studies at Athens have been underway since 1896 there exist a great number of excavations from in and around the Greek and Roman cities. The results have been published in a series of final excavation reports.

Each excavation has produced an actual-state plan or a stone for stone drawing. One of our current objectives is to digitize many of these actual-state plans and to scale or rotate them, where necessary, to fit the precisely surveyed monuments. In this way it has been possible to recreate, literally block for block, the excavated remains of the successive phases of the city. Each of the actual-state drawings is retained as an independent entity in our drawing archive and then can be imported into the larger survey drawing, when needed. In this way, a very precise physical site survey is combined with accurate stone for stone actual-state drawings of the site. There exist now over 250 actual-state plans that have been carefully digitized, representing different structures and buildings throughout the ancient city. The goal has been to complete the stone for stone drawings of the entire excavated city.

Surveying

The following summary describes the survey techniques used during the landscape survey conducted from 1988–1997. For ease of understanding, the methodology used for surveying the landscape is divided into two segments, documenting the techniques used in the field and in the laboratory.

Field Methodology: Equipment

The field equipment includes a SOKKIA (formerly Lietz) Set-3 Total Station (which has two major components: the electronic theodolite and the electronic distance meter [EDM]), a SOKKIA SDR-2 hand-held portable computer, prism reflectors, and walkie-talkies. In the field house is a Zeos 486, 66mhz machine with 32 MB RAM.

methodologies-modern_survey01

Figure 1. A field surveyor uses the hand-held Total Station for surveying a site.

The electronic theodolite is used for standard angle measurements and the EDM for distance measurements. The factory specifications of the equipment include an accuracy in angle measurements of 5 seconds of one degree, and in distance measurements of 5mm with a maximum range of 2800m (with a triple prism reflector). Distances are measured by means of a modulated beam of infrared light that is emitted and reflected back to the instrument through a prism. The infrared light is also used in all angle measurements. The Total Station, which is powered by small rechargeable batteries, has built into its memory a number of self-contained functions which include the measurement of slope distance, horizontal distance, and vertical distance as well as more specialized functions. From three known positions in the field, the instrument can determine its own location in three-dimensional coordinates, store this information, and then automatically calculate the three-dimensional coordinates of any point that can be sighted within the range of the instrument.

The battery-operated portable computer, SDR-22, with 64Kb of memory is capable of storing over 2200 field observations and has resident in it a dozen survey and trigonometric functions. Many typical operations, e.g., inverse, resection, traverse, and computation of plane coordinates, can be executed by the hand-held computer and stored in its memory. At the end of a day’s surveying in the field, the memory contents of the SDR-22 can be transferred to the microcomputer in the field house. It was found advisable to make this transfer after approximately 300 to 400 measurements had been made (usually meaning at the end of the survey day), since each sighting often requires multiple observations by the instrument, thereby using up even more memory. The hand-held computer runs on four alkaline AA batteries and can send survey data directly to a portable printer so that data can be reviewed on paper while in the field.

The stored field data can be transferred to the microcomputer by a survey link program, which then facilitates the editing of the data, its organization, and eventual sorting and plotting.

Field Methodology: Field-Data Collection Methods

Each member of the survey team, which ideally numbers four, is given an individual assignment. The instrument person, as chief surveyor, is in charge of all aspects of the operation of the EDM and the technical work of the survey in general. An assistant at the instrument aids the chief surveyor by keeping a hand written operation log which includes details of all of the work undertaken. The assistant also operates the walkie-talkie to communicate with other members of the team. Each of the other two field surveyors, sometimes working at a distance, has a separate assignment. One surveyor is assigned to hold the prism pole at the proper point on the monument or structure being surveyed. The other surveyor is responsible for accurately recording the details of the point being surveyed. This usually takes the form of simple drawing and notes, sometimes including measurements, although it can also include photographs. The field surveyors utilize a walkie-talkie to maintain constant communication with the chief surveyor. A team of two, eliminating the assistant on both ends, is possible, although the time needed for the process would be increased considerably and the possibility for error increased as well.

modern_survey02

Figure 2. Surveying with total station. Photograph D. G. Romano.

modern_survey03

Figure 3. Surveying in the Roman forum. Photograph D. G. Romano.

As with any standard optical equipment, the most important aspect of the survey routing with electronic equipment is the setup procedure. This must be done precisely in order that the accuracy of the day’s data can be ensured without the need of further processing. Therefore, the setup coordinates are checked several times before the day’s work is begun. If the sighted coordinates of a setup point differ by more than 7mm from the known coordinates, the setup is redone or different secondary points are used. Each day’s activity is begun by leveling the instrument and testing the battery. Then the reflector is sighted at the first of our known coordinates through the lens of the instrument. A reflector ca 7.5cm on a side mounted on a telescoping metal pole, with an accurately measurable length, is used. The reflectors contain prisms designed to reflect the infrared light sent out by the Total Station back to the instrument. The instrument sends out over 4000 pairs of infrared emissions of two different frequencies and wavelengths, and measures the wavelength phase-shift indicated by the light reflected back to the instrument. The instrument then calculates an average reading and returns the distance to the sighting point. Our maximum distance measurement for this process when there is no haze is ca. 2200m with a single prism and ca. 2800m with three prisms. Average conditions in Corinth, because of persistent summer haze, provide for a maximum distance measurement of up to 400m less in both configurations. For optimal results, the single prism is used for sightings up to one km, and the triple prism only for those at a greater distance. The walkie-talkies are essential not only to direct the movements of the field surveyors but to ensure that the correct prisms are in use.

modern_survey04

Figure 4. Surveying the Temple of Apollo.

During the survey itself it is common to take multiple sightings of various kinds on a structure or monument. For instance, when surveying a fortification wall it is necessary to sight the inside face of the wall, the outside face, towers, or other elements of the structure. Each of these may be coded as the survey is being carried out and entered into the hand-held computer. This makes the later reconstruction of the wall on the computer screen more straightforward. At the same time, one of the field surveyors makes a hand drawing of the wall, noting the surveyed point number given by the chief surveyor, along with the feature code and any other relevant information.

A review of the day’s survey data can be made during field operations by looking at the data review screen of the portable computer. The day’s data can also be printed out directly from the SDR-22 using the portable field printer. In this way any difficulties or errors with the field operations can be immediately recognized and corrected without having to return to the field house.

At the end of the day’s work the data are transferred from the portable computer to the microcomputer in the field house, where data editing and storage are completed. Sokkia survey software enables direct transfer of survey data using AutoCAD’s file exchange format (DXF).

Field operations take the survey team to low-lying areas in the midst of lemon and olive orchards near sea level on one extreme, to the summit of Acrocorinth (563m) on the other. There are three geodetic markers within the ancient city and a fourth is set at Lechaion on the Corinthian Gulf. In order to employ the Greek geodetic grid within the city of Ancient Corinth, the instrument was positioned near the summit of Acrocorinth within sight of the three geodetic pins inside the ancient city proper at Acrocorinth, Kraneion, and Villa Roma, respectively, and a triangle was set up upon which to base the grid. Using the geodetic pins as the fixed datum points of the architectural and topographical survey, coordinates were assigned to a series of secondary positions all around the ancient site. Because sighting these pins required observations at a distance greater than 1900m, a triple reflector for these long-range sightings was necessary. When corrections for barometric pressure, temperature, and curvature of the earth were applied, a small error in the initial geodetic survey could be perceived. The earth curvature and atmospheric corrections are only significant when sightings are to be made at a distance exceeding 1 km. In the survey, nearly all of the long shots (over 1 km) were used to create secondary positions.

modern_survey05

Figure 5. A geodetic marker.

Field Methodology: Field Records

Hand-written notes, sketches, and, at times, photographs have been found to be absolutely necessary to provide details of each building, grave, monument, or road. These show where the surveyed points were located, how the points should be connected (i.e., by line or arc), and whether lines or arcs should be extended to make corners, and thus simplify the processing of finished drawings. Usually, sketches were made indicating the location of each point and each number in relation to the surveyed item, and a list was kept showing the point number and pertinent information such as the course or the type of material (wall, trench, foundation, scarp, rubble, etc.) and the location on the formation (the particular face of the block, the center of a column base, etc.). In order to make the points transfer to the drawing more directly, point description information can be coded onto the computer as the points are being taken, or later during the editing stage.

Each of the computerized survey jobs as well as the points within them receive consecutive numbers so that if there is a question about a particular surveyed point, the number can be located in the computer drawing and found in the printed survey data and field notebooks. For each job, the setup coordinates, any problems encountered with them, and the associated plane transformations (discussion below) are also documented. Being able to refer to such information makes it easier to reconstruct the buildings and to overlay state-plans accurately.

Field Methodology: Plane Transformations

Occasionally there is a need to adjust, within the overall grid of the city, the location of an otherwise accurately surveyed monument or structure. This procedure involves the use of trigonometric functions to adjust field data so that they will conform to the geodetic coordinates. A plane transformation is actually a simple process that can be explained by comparing survey jobs in a landscape to a piece of paper fastened onto a bulletin board with thumbtacks, the tacks being analogous to bench marks in the survey. If the survey was accurate to begin with, the scale will remain the same when the points are moved to their new locations. This is similar to moving the piece of paper by placing the tacks in a new position on the board without removing them from the paper.

The plane transformation function can be carried out by hand, but in this case it was accomplished by using a function in MAP, survey software produced by the Sokkia Company. In order to account for differing degrees of setup error in each job, each survey job is treated as a separate entity f or the purpose of plane transformations. If there are slight problems with the secondary coordinates, the “perceived coordinates” returned by the Total Station will reflect an adjustment made in order to create a grid based on true distances. For this reason, rather than relying solely on the given coordinates of the bench marks, the average “perceived coordinates” are calculated from multiple readings on the points. This adjustment prevents corruption of the survey data and allows plan transformations to be carried out accurately.

In this project, “reliable coordinates” are those for which there is the smallest difference between the input and perceived coordinates. This difference was limited to approximately 7mm, which is just above the distance-error tolerance of the equipment. Choosing a pair of reliable coordinates on opposite sides of the Roman Forum, all other secondary coordinates were observed in the area. This process was continued until every major excavated area of the city was linked together like pieces of a puzzle. This data-integrity check, a form of triangulation, resulted in secondary coordinate changes of between 3 and 25 mm.

Laboratory Methodology: Equipment

The PC’s in Philadelphia run on the Windows 98 platform and are all Pentium or Pentium II class machines. The PC’s, six in total, range in CPU speed from 300 mhz to 100 mhz. One of the machines (166 mhz) is a laptop which has a docking station in Philadelphia, but is also used as a field machine in Corinth. All of the PC’s are networked together, using the neighborhood network option in Windows 98, to allow the user access to all of the disk space on the six machines in the laboratory. The resulting available hard drive space in the lab is 20.5 gigabytes. Although this kind of storage space is not absolutely necessary, it can and has been filled up quickly when creating and manipulating large files (10-20 megabytes) in raster and vector format. Each of the PC’s in the lab have between 32-192 megabytes RAM. All of the data produced in the lab (vector, raster, html format) are routinely burned on CD-ROM using an internal CD writer. Each CD allows for 675 MB of storage space per disk. Additionally, one of the machines has an internal Jazz drive (1 GB storage space per tape) and a ZIP drive (100 MB per tape).

The external input devices used are an 8.5 × 14 inch flatbed scanner (HP Scanjet Iic), a high resolution slide scanner (Microtek ScanMaker 35t plus) and, initially, a 44×60 inch digitizing tablet (Calcomp Drawingboard III). Large maps and plans (larger than 8.5×11 inches) have been scanned commercially on an E size (43×33 inches) sheet scanner. All digitizing is now done 'on screen’ and without the digitizing tablet. The output devices have been black and white laser printer, 8.5×11 inches (Tektronix Phaser 200i) or E size eight pen color plotter (Calcomp 1025 Artisan).

Laboratory Methodology: Software

The main objectives in the choice of software have been versatility, ease of use and, whenever possible, direct compatibility. The principal computer program utilized in this project and the vehicle with which the other computer programs work is AutoCAD R14 (Autodesk, Inc.). AutoCAD provides the facility to draw on an unlimited number of “layers,” which can be compared to superimposed transparent sheets for a hand-drawn map. This aspect of the program enables parts of the map to be turned on and off for analysis and is especially helpful in manipulating different types of information on topographical maps. AutoCAD also includes three-dimensional drawing and rendering capability; reconstructions of buildings will be facilitated with this program. All maps, drawings and images are digitized and managed using AutoCAD.

The field survey data is directly translated from a hand held computer to the laptop, using survey software (Sokkia Map 6.0). This translated data is in DXF format. Air photographs and topographic maps are scanned into raster format and viewed within the AutoCAD environment using Softdesk 8 Imaging (Autodesk, Inc.). This software works as a module within AutoCAD R14 and allows the user an additional menu setting for image manipulation. Additionally it allows the user to manipulate the raster image’s contrast, sharpness and file format. Softdesk civil engineering and survey software has been used in the project primarily for the input of topographical map information. The “Digitize Contours” function and others from the Digital Terrain Modeling module have been useful in converting the data from paper topographical maps to 3D computer maps as well as in managing the contour intervals.

Previous versions of CAD Overlay modules GSX and GSX2 (Image Systems Technologies) allowed the user to interactively manipulate the contrast and brightness of the image with a single stroke of the keyboard. Although the current software has more image manipulation options, adjusting contrast and brightness is a minimum three-step process and very time consuming. Softdesk 8 Imaging also allows a raster image to be rubber sheeted, stretched, cropped, merged and rectified to known or desired coordinates. Additional image manipulation is done using GIS software, IDRISI (Clark University) and AutoCAD Map2 (Autodesk, Inc.). The project also uses 3D Studio (Autodesk, Inc.) to produce three-dimensional renderings of architecture and digital landscapes. Database management is carried out with MS Access 97 and MS Excel.

Laboratory Methodology: Routine Procedures

A large portion of the first phase of the Corinth Computer Project has been devoted to the input of graphic data to supplement the survey information collected in the field. This has included the digital conversion of a series of topographical maps produced by the Greek Geodetic Service. The maps, confirmed as reasonable accurate by resurvey, together serve as a base map for the project. The aerial photographs used to create the maps have also yielded a great deal of supplemental information in the form of “shadow lines,” or “crop marks” as they are sometimes called, which can reveal the former course of roads and, in some cases, ancient property divisions as well as the location of buildings and monuments. Some field notebook drawings have been digitized or redrawn using incorporated measurements, when there are no other plans available.

Aerial Analysis

We have used several types of air photographs to study Greek and Roman city planning and land organization in the Corinthia. There exist both low altitude as well as high altitude photographs of the area as well as some very low level balloon photographs.

Low altitude air photographs, at an approximate scale of 1:6000, taken in 1963 by the Hellenic Air Force, correspond very well with the 1:2000 topographical maps, which were made in the same year using the air survey. The air photographs have been useful for a number of reasons. Shadows and vegetation or soil markings highlighting unexcavated underground features in the landscape, such as roads, ditches or structures are visible. These features can be helpful when put together with other forms of information, such as the surveyed and excavated roadways.

aerial01

Figure 1. Photograph by the Hellenic Air Force, 1963. Courtesy of the Corinth Excavations, American School of Classical Studies at Athens.

Before performing any analysis of any of the photographs it is necessary to first rectify its geometry in calibration with the existing maps and surveyed data. Therefore, each photograph is scanned at the resolution of 400 dpi (dots per inch) using a desktop flatbed scanner (UMAX PowerLook 2100XL) and rectified using the resampling program included in CAD Overlay (discussed below under GIS applications). The control points needed for this operation are taken from the topographical maps. The corners of buildings or the intersection of field boundaries have proven to be most precise. Once the photograph has been successfully rectified, it is possible to display it as a backdrop to the AutoCAD drawings using CAD Overlay. In this way one is able to trace over the crop and soil marks and study them in conjunction with other surveyed or map data.

aerial02a

Figure 2. Photograph by the Hellenic Air Force, 1963. Courtesy of the Corinth Excavations, American School of Classical Studies at Athens.

High altitude air photographs at a scale of approximately 1:37,500, taken in 1987 by the Greek Army Mapping Service, have helped us to understand the overall pattern of the roads and field boundaries in the larger terrain surrounding Ancient Corinth. Control points necessary to rectify these photographs are taken from the topographical maps or satellite images, where we do not have a detailed map of the entire area covered by the photograph.

A series of low level balloon photographs at an approximate scale of 1:1750 taken by Dr. and Mrs. J. Wilson Myers in 1986 have greatly assisted in the identification of details in the landscape at the Roman harbor of Lechaion. These balloon photographs have been successfully rectified to both the low level air photographs as well as the 1:2000 scale topographical maps.

Google Earth© satellite image of the amphitheater area east of ancient Corinth.

Figure 3. Google Earth© satellite image of the amphitheater area east of ancient Corinth.

Satellite Analysis

During 1993 we have added two satellite images of the Corinthia to our data set; a panchromatic scene from SPOT, the French satellite agency, and a multi-spectral scene from LANDSAT, the US satellite company.

The image from SPOT is a single spectral band scene, gray scale, acquired in May 1991 at the resolution of 10 m (per pixel) and covers an area of 60 × 60 km. The LANDSAT scene, on the other hand, is an EOSAT archive image acquired in June 1987 with a resolution of 28.5 m. It covers a larger area of 185 × 170 km and is a Thematic Mapper™ scene with seven colored spectral bands that can be displayed individually or in combination with others.

EOSAT Image of the Corinthia

Figure 1. EOSAT satellite image of Corinthia.

SPOT Image of the Corinthia

Figure 2. SPOT satellite image of the Corinthia.

The different nature of the two satellite images has dictated very different uses for them. One can see roads and agricultural field boundaries clearly on the SPOT image and, therefore, we are using it to analyze the patterns in the landscape along the southern coast of the Corinthian Gulf between Corinth and Sikyon. We have been able to identify uniform grid systems conforming to the practice of Roman centuriation. This particular study has been carried out using AutoCAD and CAD Overlay by measuring road and field spacing on the image and testing against various hypothetical grids of Roman land division.

The grid systems are created in AutoCAD and can be superimposed on the satellite image using CAD Overlay. The preliminary success of this investigation has lead us to purchase an additional SPOT image, a 15 minute by 15 minute window to the east of Corinth so that we may in the future study the land organization to Corinth’s second port of Cenchreai on the Saronic Gulf. The LANDSAT image is of coarser resolution (28 m per pixel vs. 10 m) and, therefore, is better suited to studying land use pattern, ground cover and geological interpretation. In the future we may consider these well known applications of the LANDSAT multi-spectral scene in this study.

The SPOT satellite image came in the BIL (band interleaved by line) format, which was imported into the various kinds of software that we use, e.g., IDRISI. The original SPOT image was shipped to us on a series of twenty-two 3.5” diskettes which proved to be somewhat of a challenge to download and decompress. The more recent 15 minute window from SPOT was shipped on a compact disk, which greatly facilitated its use. The total size of the larger SPOT image is approximately 50 MB while the total size of the LANDSAT image is approximately 360 MB. These large files are stored on an auxiliary optical disk (Panasonic Optical Disk Drive LF-7010) and parts of the scenes have been clipped for processing and analysis as necessary. The LANDSAT scene came on mainframe 'computer compatible tapes’ (CCT), which necessitated the use of university facilities to download the files onto our PC’s. This was accomplished by utilizing a 250 MB tape backup system (Colorado Jumbo Trakker).

Satellite image of the Corinthia, no spectral change.

Figure 3. Satellite image of the Corinthia with no spectral change.

Topographic Analysis

Sixteen 1:2000 topographical maps from the Greek Geodetic Survey have been digitized to create the topographical foundation for the immediate area of Roman Corinth, roughly 35 square kilometers.

The topographical maps include information such as modern roads, paths, ledges, property lines, field lines, houses, as well as topographical contours. It has been noted, for instance, that several modern village roads still have as their orientation the Roman roads of the colony (Fig. 1).

Modern roads and houses on the drawing board plan

Figure 1. Topographic map with Roman Insulae superimposed with modern houses and roads.

In addition some modern house and lot lines still respect the ancient Roman insulae and, in the areas surrounding the city, it has been noted that aspects of the modern field boundaries still reflect vestiges of the ancient Roman land division, with some lots retaining the original colonial orientation as well as maintaining widths of 1 Roman actus of 120 Roman feet (Fig. 2).

fig07

Figure 2. Topographic map with Roman Insulae superimposed with modern house and lot lines.

From the contour lines of the topographical maps it has been possible to utilize other engineering and GIS programs to create digital terrain models of aspects of the site, general three dimensional computer images of the landscape as well as to run three dimensional GIS functions.

Cartographic Modeling

In 1992–1993, a digital terrain model (DTM) was created with a component of Softdesk, Inc., a civil engineering program to study the topography of the areas surrounding Corinth.

The software assisted in transforming the digitized elevation data (contour lines) from a series of 1:2000 topographical maps into a rendered multi-dimensional landscape. (Fig. 1). This process was done for ca. 35 km2, which is the entire area of coverage for the 1:2000 topographic maps. This created a large DTM, which was based on a 20 m2 grid with 5 m segments. Such a resource allowed for analysis of the Greek and Roman landscape at all scales.

fig17b_2withbackground

Figure 1. A multidimensional topographic landscape of the Corinthian landscape.

One such example, involved the creation of a series of detailed DTM’s to understand the topography of the ancient Greek and Roman city. In the late 19th and early 20th cs., during the early years of the excavations at Corinth, a huge excavation dump created an artificial peninsula of land that extended from Temple Hill (where the Temple of Apollo sits) out to the north (Fig. 4). The total length of the artificial mound is approximately 200 m and its maximum height is approximately 15 m. In the modern day, the excavation dump literally obscures a clear view of the nature of the topography of the ancient landscape. It was decided that the modern dump would need to be digitally removed in order to analyze the ancient topography underneath the excavation dump.

First, a DTM was built from the contours of the topographic map, reflecting the appearance of the area in the modern day (Fig. 2). The model accurately represented the modern day topography of Corinth, clearly illustrating the relationship (and focus of the excavation) between the excavation and the dump.

3dmodeling_dumpzoom01

Figure 2. Modern day landscape represented via a DTM.

The second DTM was created by connecting the contour lines east and west of the artificial peninsula of land to create what may be a reasonable representation of the landscape before the excavation dump was created (Fig. 3).

3dmodeling_dumpzoom02

Figure 3. A DTM representing the potential landscape prior to the placement fo the excavation dump.

The next figure (Fig. 4) clearly illustrates how immense the excavation dump was when it was created during excavation of the forum area in the late 19th and early 20th c. The next figure shows the excavation dump as it appears today, as a major man made topographic feature (Fig. 5).

3dmodeling_dumpzoom03

Figure 4. Photo of the excavation dump at the time of the forum's excavation.

3dmodeling_dumpzoom04

Figure 5. The state of the excavation dump as it appears today.

The lab has used Autodesk Inc. 3D Studio MAX to generate renderings and animations of the DTM of the 35 km2 area of Corinth, some including the colonial and Roman grid, the Greek city walls and the area from Acrocorinth in the south to the the Gulf of Corinth in the north. These images have assisted in the re-creation of the landscape and are especially useful in demonstrating gross topographic features. A static 3D model of the landscape looking south from the Gulf of Corinth was created, the lab then produced a 3D “fly through” of the environs surrounding Corinth. (Fig. 6)

fig16

Figure 6. A 3D model of the Corinthian landscape looking south from the Gulf of Corinth.

A further reconstruction of the ancient landscape was created by combining the three dimensional terrain with the location of the Roman colony, Greek city walls, and Roman land division. (Fig. 7).

3dmodeling_landscapezoom02_1

Figure 7. A composite landscape including the Roman colony, Greek city, and Roman land divisions.

Spatial Analysis

One important area of Corinth that remains virtually unstudied is the region to the northeast of the forum, identified as having an unexcavated Roman amphitheater.

gis_amphitheater01.jpeg

In an attempt to better understand this area and how it relates to the overall Caesarean city plan, the lab analyzed the cartographic attributes of the amphitheater and its environs.

The remains of a large amphitheater are visible approximately 1000 m to the northeast of the forum. A large (78.6 × 51.6 m) elliptical depression in the modern fields mark the remains of the ancient facility (Fig. 1). The floor of the structure, arena, and the stone seats were cut out of the bedrock and it is likely that the original superstructure was constructed of wood.

gis_amphitheater02zoom.png

Figure 1. Low level aerial photograph of the amphitheater taken by the Hellenic Air Force. Courtesy of the Corinth Excavations, American School of Classical Studies at Athens.

The location of the amphitheater, in the northeast corner of the “drawing board plan” of the Caesarean colony of 44 B.C.E, would be have been in keeping with the design of Roman cities, where amphitheaters were commonly situated immediately inside or outside the limits of the city. A roadway, cardo XXVII east, approaches the amphitheater from the south and served as the principal access to the structure (Fig. 2).

gis_amphitheater03zoom

Figure 2. Caesarean city plan with amphitheater.

The point at which the roadway met the amphitheater was likely to have been the Porta Triumphalis that would have served as the entrance to the arena for the gladiators and other performers. At the north end of the amphitheater is a rock cut entrance that likely would have been the Porta Libitinensis, the exit for gladiators and animals. One of the only plans produced of the amphitheater in Corinth comes from Abel Blouet, a French scholar, who published the plan to the right in the 1830’s. The plan clearly illustrates the elliptical shape and the seating plan of the amphitheater (Fig. 3).

gis_amphitheater04zoom

Figure 3. Blouet drawing of amphitheater.

The amphitheater was the place where gladiatorial games, munera gladiatoria, were held. Gladiators were usually prisoners of war or condemned criminals and were known to be of four types: the murmillo who carried a short sword, a rectangular shield and a helmet with a fish crest; the Samnite who had a short sword, oblong shield, greaves and visored helmet; the retiarius who fought with a trident and a net and the Thraex who carried a round shield and a curved sword. Other events that likely occurred in the amphitheater included wild animal hunts, venationes.

It is interesting to note that during the 2nd and 3rd cs. C.E., both the odeum and the theater near the forum of Roman Corinth were readied for gladiatorial contests. In both cases, the orchestras of the facilities were converted for use. In the theater, wall paintings have been discovered that depict gladiatorial contests and wild beast hunts. Figures 4 and 5 are frescos taken from the theater in Corinth. They depict scenes of gladiators fighting the types of wild beasts that were imported into Corinth for the gladiatorial games. Figure 5 depicts two gladiators highlighted in blue fighting a bull, highlighted in yellow.

gis_amphitheater06zoom

Figure 4. Fresco of a gladiator fighting a lion from the theater in Corinth.

gis_amphitheater05zoom

Figure 5.Gladiator fresco fighting a bull from the theater in Corinth. Two gladiators are highlighted in blue fighting a bull, which is highlighted in yellow.

Welch, K. “Negotiating Roman Spectacle Architecture in the Greek World: Athens and Corinth.” In The Art of Ancient Spectacle. Eds. B. Bergmann and C. Kondoleon, 125-145. New Haven, 2000.


For instance, in regard to the gladiatorial shows the Athenians have so actively emulated the Corinthians or really have surpassed them and all others in their mad infatuation, that whereas the Corinthians watch these combats outside the city in a gully, a place that can accommodate a crowd, but otherwise is dirty and such that no one would even bury a freeborn citizen there…

Dio Chrysostom, 31.121 (translation adapted from the Loeb Classical Library)

Historical Views

These photographs illustrate the amphitheater in the early 20th c.

gis_amphitheater08zoom

Figure 6. Northern end of the amphitheater including the subterranean passage.

gis_amphitheater09zoom

Figure 7. Amphitheater floor and aspects of the seats in the eastern section.

gis_amphitheater10zoom

Figure 8. Arena floor, looking southeast.

Cartographic Models

The illustrations below are 3D models of the amphitheater region that where made by digitizing 1:2000 topographic maps. After digitization in AutoCAD, the contour lines were assigned their appropriate Z value. The 3D contour lines were then imported into ArcView and a either a wire-frame model or a Triangulated Irregular Network (TIN) was rendered. The final stage before analysis was to drape ground level or aerial photograph over this 3D model for further ground cover relief or enhanced visualization.

gis_amphitheater12zoom

Figure 9. Contour lines from the amphitheater region combined with a TIN skin.

Figure 9 illustrates the 3D contour lines combined with a TIN skin. Figure 10 illustrates a 3D model with various shades of color denoting elevation change. Figure 11 illustrates the “drawing board plan” of the Caesarean colony of 44 B.C.E. draped on top of the 3D model.

gis_amphitheater13zoom

Figure 10. Counter lines with a TIN skin and color change denoting changes in elevation.

gis_amphitheater14zoom

Figure 11. Figure 10 with the "drawing board plan" of the Caesarian colony overlapped.

The figures below (Fig. 12, Fig. 13, and Fig. 14) demonstrate how this type of computerized data can be used for interpretative purposes. These figures show a low level aerial photograph draped on top of the initial 3D model. Remote sensing, slope analysis and historic view sheds are examples of useful research that can be conducted with this type of 3D data.

gis_amphitheater16zoom

Figure 12. Aerial photograph overlayed upon the 3D model used in Figures 9-11.

gis_amphitheater17zoom

Figure 13. Aerial photograph overlayed upon the 3D model used in Figures 9-11.

gis_amphitheater18zoom

Figure 14. Aerial photograph overlayed upon the 3D model used in Figures 9-11.